Friday, May 7, 2010

Assembling Virginia's Geospatial Data with Google Earth Enterprise

Over the course of the past few weeks I've spent some time scouring the internet and university websites in the Commonwealth of Virginia to try to collect as much publicly available geospatial data as I could. To my delight, there is a lot more data online now than back in the 2000-2005 timeframe while I was a student at Virginia Tech's Geography department, working with Virginia GIS data quite regularly.

However, it could be a lot simpler. Not only did I have to spend a great deal of time searching for the data, often it was warehoused in sites that were not friendly to bulk downloading the entire state at once. Some scripting helped here, but it was still somewhat cumbersome.

I also found lots of dead links, even on sites like Virginia.gov. This includes the occasional missing file, or worse, sometimes entire data-sets have disappeared.

Also I have to say that my overall experience working the nearly 500GB of data that I did find was disappointing. Data in the Commonwealth of Virginia is primarily found in one of five projections.
  • UTM Zone 17
  • UTM Zone 18
  • Virginia State Plane North
  • Virginia State Plane South
  • A custom Department of Transportation Lambert Conical Statewide projection
  • or, Unprojected WGS84
Now, knowing this helped a great deal because SOOOOO MUCH of the data comes without accompanying projection files, or any metadata that describes what projection any given piece of data may be in. Frustratingly, much of the data was also commingled so that you might literally have all 5 projections for a single data-set seemingly randomly distributed throughout a single data-set. This likely occurred because the data was never really assembled all together in a seamless GIS before, and instead the tiles were used one or two off at a time in desktop GIS software. 

I wanted to be able to visualize all this data in one environment though, so I've done a lot of work to fix the problems, and where possible, track down the source data from the original providers. I'm very happy to find a good steward of this data for the Commonwealth now that I've corrected it so that others can find clean data to use in their project. 

I have only just scraped the tip of the iceberg of the total GIS data for the Commonwealth - there is so much more out there hidden in all of municipalities web-based GIS systems that would be fantastic to incorporate. 

I also hope that one day the work I've done on the Google Earth Enterprise system will be made available to the citizens of the Commonwealth. After all, it is your tax dollars that are paying for all this data - you should demand a way to use it easily! 

If you're interested in seeing the Google Earth Enterprise for the Commonwealth of Virginia's progress thus far, and for more discussion about existing GIS data-sources in the Commonwealth, please view the video below. 

If you have any questions please leave a comment, or e-mail my colleague at Google, Mary Jean Clark.

Friday, March 5, 2010

Geotag Photos with an Android Phone and Any Digital Camera


There are many ways to add geospatial information to photos, whether you use Flickr or Picasa's Heads-Up Digitizing Tools, or an expensive camera with a built-in GPS, a camera phone that has a built in GPS, or a GPS Data Logger and a standard Digital Camera. However, I wanted to share a way I use an Android Smartphone (Motorola Droid) and a standard point-and-shoot Digital Camera (Canon SD780 IS) together in a hybrid approach to automatic geotagging. 

This approach lets me cut down on the devices I need to carry along with me (don't need to carry a GPS data logger anymore), and lets me shoot higher resolution images than the 5MP camera on the Droid would allow. 

The Tools You'll Need:

Android Apps:

My Tracks for Android:

GPS Test for Android:
Linux / Mac / PC App:

gpicsync: Follow the instructions for installing on your OS.

Step 1. Start Logging:

Launch My Tracks and from the context menu choose "Record Track," this will start the My Tracks data logger. 

You'll need to keep your phone out (screen can turn off) for the duration of your picture taking - My Tracks will record your track.

Step 2. Launch GPS Test:

As with using a stand-alone GPS, you need to take a temporal reference photo to figure out the time difference between the GPS system (in which your log file will be recorded) and the camera time (which will be timestamped in each image). 

To take this image, use the free app GPS Test to display the current GPS time in the UTC time zone. 

Step 3. Set Your Camera's Time:

My camera has a home / away function so I can set my home time zone but also an "away" time zone - in this case my "away" time zone will be UTC time. Your camera may vary, but try to set the time as closely as possible to the UTC time shown in the time screen of GPS Test.


Step 4. Take a Picture of Your Phone:

From the Time screen in GPS Test, take a photo of your phone's screen with your camera - this picture will serve as your temporal reference in gpicsync so you can investigate the time difference between the GPS and your camera when you go to sync the photos to the GPS track.


Step 5. Keep You Phone Out, Take Pictures:

Your phone can probably stay in your pocket, but it needs a view of the GPS constellation to record your track well.

Step 6. When Finished Shooting, Stop Recording Your Track:

Use the context menu in My Tracks to select "Stop Recording".

You should have a nice map that shows you the track you collected.

Step 7. Send Yourself Your Track:

Use the "Share With Friends" feature of My Tracks to e-mail yourself a "GPX" version of your track, you will use this file as your track in gpicsync.


Step 8. Launch gpicsync, Fix Time: 

The first thing you need to do is to set up the time correction, from the Options menu choose "Local Time Correction"

Open the temporal reference image in a program like Google's Picasa, or just Windows Explorer or Mac OSX's Finder to simultaneously see the timestamp (camera date) of the image and the time that is shown by GPS Test for the UTC time.


Enter these values into the Local Time Correction Dialog.


Step 9. Select Your GPX Track and Photo Directory

For the "Pictures Folder," select the directory on your computer where you have downloaded the photos you want to be automatically geotagged in the gpicsync application. 

For the "GPS File," select the GPX file that you previously e-mailed yourself. 

Click "Synchronize" and gpicsync will index the times in the GPX file and then for each image in the directory check the timestamp of that image against the index to see where you were when that photo was taken and automatically will update the image's EXIF Header to include a GPS position. 


When finished, you will have a directory of automatically geotagged photos, a backup of the original photos, and even a KML file that you can open and view your photos spatially in Google Earth.

Or, you can just upload the photos to a site like Flickr or Picasa and the website will automatically read the EXIF Headers and will store your photos as geotagged photos online.

Check out an example of a recent Helicopter tour I took with my parents and the geotagged photos I took using this method here.

Tuesday, January 19, 2010

Utilize NGA Geoprocessing Tasks For Haiti in Your Applications

I was very impressed last week with the speed in which the National Geospatial-Intelligence Agency's eGEOINT Management Office made some useful web-based GIS tools available for first responders to the Haitian Earthquake.

The "DemoBase Haiti" site unfortunately still only works in Internet Explorer, which I've communicated to the agency is DEFINITELY NOT the browser of choice for pretty much anyone I know that is responding to the earthquake with their geospatial skills.

Go to a CrisisCamp or OSM Mapping Party and count the default IE users on one hand....they probably just got a laptop with Windows and haven't had a chance to install Firefox or Chrome or to wipe the hard drive and install Ubuntu :)

However, IE remains the security-threat cesspool of choice for the US Government computers so I guess most development STILL gears itself with IE as a baseline.

Well, I thought it would be useful to expose the really powerful pieces of the DemoBase tool, the Geoprocessing Tasks, to anyone that wants to call on the NGA / NRL servers in their web-based applications.

The DemoBase tool currently has one very nice GP task, a Zonal Statistics tool that allows you to draw a polygon anywhere in Haiti and get back a Population estimate.....as accurately as the ESRI Zonal Statistics tool and the NGA data is anyway.....like I said, it is an estimate.


But, it could be incredibly helpful for those on the ground to be able to view recent imagery in an application and then just digitize a polygon on a city block of rubble and be able to estimate the population of that block.

I'm not a full time ESRI JavaScript API developer, but I did get some help from David Spriggs at ESRI to boil down a process for sending a simple polygon to the ArcGIS Server and receive a population estimate in return - I hope it is helpful for anyone trying to add some analytic capability to their Haitian support efforts.

I also hope that a more widespread use of the geoprocessing tasks will show the agency how powerful exposing these services can be and they'll continue to offer more geoprocessing tasks to their current offering - lord knows they have the data to make some very useful and interesting applications....

In my example, I simply create a polygon (a rectangle) out of an array of coordinate pairs - but you should be able to adapt the functions to any GeoJSON or other polygons you might have in your application.

My code will simply initialize and send the polygon through to the Geoprocessing Task and then display the result.

Here is the code

Friday, January 15, 2010

Haitian Earthquake Emphasizes Danger of a Split Geo Community

My career has afforded me the opportunity to be part of what I believe to be a wonderful and generous community; the world geospatial community. A typically happy group of geo-nerds armed with laptops, gps enabled gadgets, and a strong foundation of thinking spatially.

Now, this community certainly has some big business motives behind it, but whenever there is a disaster, or crisis like we are seeing now in Haiti, this community comes together and throws everything it has to offer to help. It energizes me to do what I can to help in these times of need and dedicate myself to applying my trade to the cause. And as a Google employee, I'm blessed to have the full support of my management to work full time when necessary on these events.

While the first few hours of this particular disaster were frustrating as I watched the machine slowly gear up, I am blown away at the response we've pulled together - we're actually learning from these events and each one seems to get a little easier to manage - even if the scale of the disasters always seems to increase.

I sat on an early conference call with representatives of all the major GIS vendors, first responders, geo-nerds, NGOs, govies, and the media where everyone brought what they could do to the table and people teamed up to go do what they do best together.

For example, I watched Google, DigitalGlobe, and GeoEye all work together to get stunning imagery collected, processed, and published FREE to the international community to help a wide array of aid workers and first responders within 24 hours.

I watched the National Geospatial Intelligence Agency, the US State Department, and other government agencies get critical and informative data and applications out the door and into the hands of people that needed them within mere hours of the disaster - a far improvement from the Katrina days!

Perhaps most impressive has been the response that Mikel blogged about to the utter lack of vector data that the Geo Community had access to just after the earthquake.

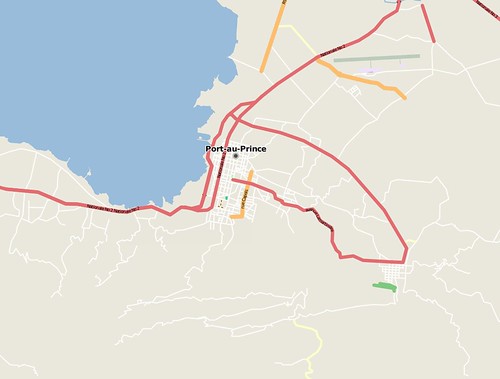
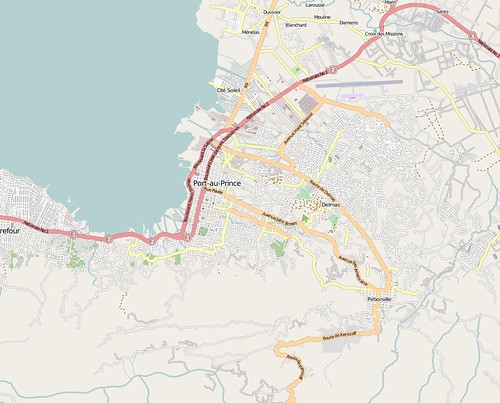
Stealing his images, just look at the difference in OpenStreetMap Port-au-Prince in just a few days of the Geo Community swarming and finding old CIA library maps, public domain maps, etc and the new imagery released by the commercial satellite providers.


OSM just after the Earthquake


OSM Today


Now, that transformation is wonderful - it is astounding - but it isn't complete because there is a Split in the Geo Community that isn't being well addressed.

OpenStreetMap is not the only community data collection platform - Google also has MapMaker which has similar tools and goals, and has done a very great job of expanding Google Maps to areas of the world where data was not traditionally available. If I lived in an area that previously had blank Google Maps coverage, I was given the tools to fix that problem and many users around the world have been happy to work on maps of their own area so they can enjoy Google Maps, Directions, etc.

I thought it was great that in addition to the countries from which Google already allows non-profits to download MapMaker data, that Google added the data from Haiti and is now allowing any non-profit to download and use Google's data to help during this crisis.

But OSM and MapMaker aren't talking and I think it is a big problem - if you want to help rescue efforts in Haiti where do you go to digitize? OSM? MapMaker?

How can 2 projects be expected to be in synch? Which is more "correct"? Which is more current?

This split means that these questions have to be asked by first responders, and by those working to create products for them.

"Is that road up there passable?" "Does it really exist?"

It means that the Geo Community is responsible for an extra decision between a first responder and a VICTIM.

As it stands right now, even though the MapMaker data is free for non-profit use, projects like OSM can't use the data because there are commercial uses for OSM and the data belongs to Google, not OSM.

These are the old fights of GIS data; these are Navteq and TeleAtlas bugaboos IMHO, not what I expect to see today!

The differences are pretty glaring between OSM and MapMaker in some cases - take a look at the data I downloaded from both over Port-au-Prince.


The data is similar, but different, and needs to be conflated. Where that conflation happens, how it happens, I don't know - but I do know that we need to do something to fix this split before it gets people hurt.

That said, it is good to have 2 or more different projects; it forces competition in the tools, each project has different goals and metrics of success, and it probably ultimately means more community contribution as different groups migrate to different platforms  - all adding to the cumulative Geo Community base data.

However, the data ultimately has to be conflated somewhere - and I urge OSM and MapMaker to work more closely with each other and build some sort of cross platform utility that lets users share edits and co-create data.


Sunday, August 9, 2009

Preparing for Afghanistan Elections and Humanitarian Efforts


Some fellow Google engineers and I participated in the Summer 2009 Nangarhar PEAK activity at Camp Roberts near Paso Robles, CA. We got to work with some of the great crisis management and neogeographer minds for a few days as we prepared government provided data for Todd Huffman, whom works for an NGO to take to the field.

Todd will be observing the upcoming Afghanistan elections and will be using the technology we glued together this week to help him do so, as well as continuing his many nation-building NGO efforts.

The bulk of the data was provided by the National Geospatial-Intelligence Agency, but it was provided in a raw format, with no geospatial viewer.

The Google Earth Enterprise team knew we could help out, and we processed the imagery for Todd through Google Earth Fusion, and then published the data as a map, and 3D globe to a Google Earth Enterprise Server running in an Ubuntu Virtual Machine connected to a mac-mini which was provided to Todd to run GeoCommons by FortiusOne.

Within a few hours of the first day, we had our imagery tiles being consumed by many web-based Geospatial applications that Todd would also be able to take to the field with him.

Most of the applications were already configured to work with Google Maps on the Internet, so they knew how to utilize our tiles. In many cases, only a few lines of code and new URLs had to be added to their software packages to work with our Enterprise version of Maps which can be used on or offline.

First - Mikel Maron of the OpenStreetMap Foundation, Josh Livini of Umbrella Consulting, and Michal Migursky of Stamen Design Walking-Papers.org and got our imagery tiles feeding in as the basemap for the Walking Papers slippy map.

Michal built Walking Papers for users in mixed tech environments to print out hard copy maps from OpenStreetMap and bring them out in the field to take notes and collect data. Users can then bring their paper maps into Walking Papers by submitting a scan of them, and their notes and annotations are automatically re-georefferenced to the map thanks to some QR code magic.

This alone is a substantial advancement - keeping the loop of geospatial production working without ever loosing georeferencing and causing users to have to do extra work.

Todd has already mapped out a lot of Jalalabad, but is going to be helping the locals to do a lot of the mapping in their homeland themselves to build out the data on OpenStreetMap.org. Walking Papers will allow him to orchestrate this without having to have a lot of computers or other tech gear to worry about - just print a map and give it to a local expert to annotate or send them out in the field to mark points of interest and street names. Since many hardcopy maps are going to be printed, the team realized there was an opportunity to use them for multiple purposes.

Josh injected some Python scripting in the Walking Papers workflow which creates an arbitrary grid on the image, and has the ability to apply transparent tiles from the Google Earth Server or from OpenStreetMap thanks to Mikel Maron's work over the base imagery. The grid is intended to allow someone in the field, with no GPS, to use a simple, cheap cell phone and report incidents via SMS by utilizing one of the other technologies that integrated with the Google Maps - InSTEDD's GeoChat .

The grid Josh designed was optimized to make it easy on the end user to report back position over SMS with minimal character usage - and it is scale agnostic. The grid pairs to the map ID on the Walking Papers map, and then GeoChat translates the coordinates on the fly and can display them as an overlay on a map and be read by users in multiple formats; Lat Lon / MGRS / USNG , etc.

Walking Papers was ported to run offline by Josh and Michal and now resides in a local capacity on the same virtual machine and hard drive that is running the Google Earth Enterprise Portable server.

The guys from Sahana and Development Seed were able to bring our tiles into their Content and Disaster Management systems as well, and Andrew Turner was able to log in to his donated server remotely and reconfigure GeoCommons to use the tiles as well. Now all of these platforms have the code in place to pull tiles from Google Earth Enterprise servers in the future when the next disaster strikes.

All paired together, a mobile deployer or crisis responder can take a very light weight but powerful suite of geospatial utilities in the field for stand-alone use, or connect to a network and serve their data out with other local and remote users - with or without Internet connectivity.

I was truly impressed with this group - we knew what our objective was and knew where our different technologies could come together and provide the needed solution. For me, it was wonderful to see a compelling use of our technology and watch it work pretty much flawlessly with open geospatial technologies as we've been promoting. Not bad for a few hours of hard work and a group vision.

*UPDATE:

Mikel Maron's Summary of the Work @ Brain Off

http://brainoff.com/weblog/2009/08/10/1410

http://brainoff.com/weblog/2009/08/10/1435

Development Seed Blog:

http://developmentseed.org/blog/2009/aug/07/integrating-50-centimeter-data-national-geospatial-intelligence-agency

http://developmentseed.org/blog/2009/aug/05/data-collection-simulations-field-camp-roberts

Eric Gunderson's Photos:

http://www.flickr.com/photos/developmentseed/sets/72157621841118753/

Tuesday, March 3, 2009

Open Geoprocessing: Let's Share Some Code

About 2 weeks ago, I released a screencast discussing the use of the Google Earth API and the ESRI JavaScript API to bring Geoprocessing capability to the free Google Earth platform.

Since that time, I've been demonstrating the demo at the Google Earth Enterprise Users Conference, the ESRI Federal Users Conference, and the NOAA GeoTools conference, and lot of folks have asked for the source code.

I always wanted to make this code open and available for all to implement and improve on, so I've released it to a new Google Code Site: Open Geoprocessing.

I'm looking for anyone interested in flushing out some of the functions to make it more robust, but also looking to move on from utilizing the ESRI JS API for the geoprocessing to doing the same type of geoprocessing using some completely free Open Source Geo tools.


Here's how I see this working, let me know if I'm totally off in the wrong direction:


Tuesday, February 17, 2009

ESRI Geoprocessing in Google Earth

I've heard it for years: "Google Earth is great, no really, I love it, but....it's not analysis."

OK - I guess what you've been saying is that while hundreds of millions of people have downloaded Google Earth all around the world, and have used it to prepare for and respond to natural disasters, find drug farms , protect the rainforest , bring attention to and spatially explain the Crisis in Darfur, even do Imagery Intelligence Analysis - that all of this is "just qualitative analysis."

Tough crowd.....

So despite all of those things, I still hear that Google Earth isn't analysis, and this almost always comes from staunch GIS shops.

Hey, I understand - I'm a GIS guy too. I guess what you're getting at is that unlike the GIS systems you've always used, Google Earth is more of a Geospatial Exploration System, and you want to be able to do some qualitative analysis - some geospatial analytics.

Ah, maybe some Geoprocessing?


Geoprocessing is a GIS operation used to manipulate GIS data. A typical geoprocessing operation takes an input dataset, performs an operation on that dataset, and returns the result of the operation as an output dataset. Common geoprocessing operations include geographic feature overlay, feature selection and analysis, topology processing, raster processing, and data conversion. Geoprocessing allows for definition, management, and analysis of information used to form decisions.[1]


OK, so what if we could extend that Google Earth user experience to be able to leverage your current or future geoprocessing capabilities?

I first saw the potential for this, before coming to Google, when Jack Dangermond and John Hanke co-presented at Where 2.0 last May.

They showed a great little demo of the Google Earth client communicating with the ESRI ArcGIS Server, but you could tell the communication was a little bit of a kludge.

They were using the embedded browser and the center of the Google Earth ?BBOX= NetworkLink information to pull the demo off.

That was before the Google Earth API (3D Google Earth browser plugin) was released.

Now however, we can actually build this application utilizing simple JavaScript and capturing key user events, then passing these events as real geometries over to the ESRI ArcGIS Server JavaScript API and do it all right in the web browser!

Watch a short screencast of the application below:


I first started working on this back at GEOINT in November where I quickly hacked together a side-by-side example of the Google Earth API and the ESRI JSAPI , and then demoed some more refined progress last week at the Google Earth Enterprise User's Conference in D.C.

Durring that demo however, I was still unable to conduct the second required geoprocessing task on any drive-time-rings that were complex or that covered a large area - which was most of them.

It turns out, that there is a pretty significant limitation on geometries that you send Geoprocessing task queries on the ArcGIS Server if you're not running your application on the same server as the ESRI software.

It bombs out if the geometry in the query exceeds 2,000 characters (which is a browser limitation) and the only way around this currently is to complicate the ESRI JSAPI by deploying a proxy in ASP.Net or Java / JSP...

This is a shame, it really makes things more difficult than I'd like them to be for interacting with ArcGIS Server services - I don't think I should have to mess with Tomcat configurations to get things working...but alas, we do for now.

Ok, now off to the ESRI Federal User's Conference - I'll be demoing this application at the Google booth, so stop by and say hello and check it out and tell me how much you hate it in person :)

I promise to have some well commented source code and a link to try out the application up on Google Code ASAP!

Next up - Geoprocessing with some Open Geospatial tools on the backend.....stay tuned.