Sunday, October 28, 2012

Offline Maps for Hurricane Sandy, Built By OSM Data in TileMill, Available for Entire Northeast United States


As Hurricane Sandy looms off the eastern seaboard, posed to cause a massive incident in the United States, one of the largest concerns is for prolonged power outages, and possible connectivity outages due to downed towers and utility lines.

No Power + No Internet =  No Internet Based Maps.....  Unless..

Thanks to the awesome TileMill software by MapBox, I was able to generate tiles for the entire North Eastern United States down to level 15, in beautiful and useful detail in about 9 hours.  You can see the extent of the cut below.

I've tried to scope the cut to the areas most likely to be impacted by the exceptionally large Sandy based on NOAA's projected storm path.


MapBox allows tile sets to be exported in the open MBTiles packaging format, which is a SQLITE database that contains the tiles and any metadata. 

Anyone that might be working in the field, or working with first responders in the impact area might want to download this dataset for your use if you lose power and or internet connectivity during the storm and the likely prolonged response and recovery period. 

I can't vouch for the total accuracy of the data or the rendering of that data since it is entirely sourced from OpenStreetMap and MapBox's OSM Bright styling, and take no responsibility for your use of the data.

You can download the 16GB MBTiles package here.

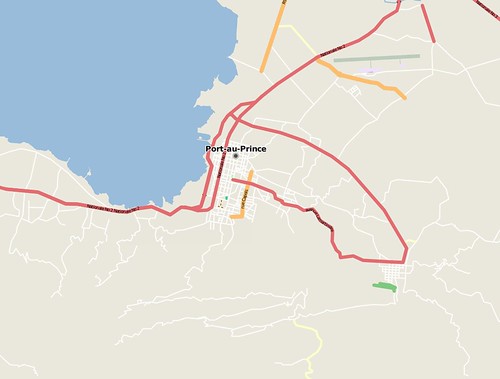
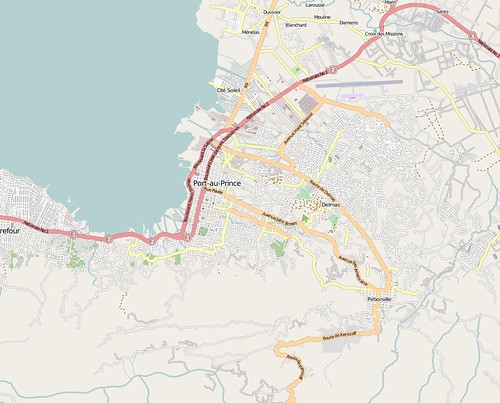
Here are a few example screenshots of the level of detail provided in this tile set in various locations in the northeast. 

New York, NY

Washington, DC

Boston, MA

Manasquan, NJ


Since the entire package for the northeast is ~16GB - it is too large to put on an iPad or other mobile device, but, the tiles are generated and it is easy to dump the tiles from MBTiles to a flat directory structure, or serve them on a local area network, or on your laptop and then view with a viewer like OpenLayers. 

There might also be utilities to cut smaller MBTiles packages from this one; if anyone knows of something like that, please leave a comment, or if it doesn't exist...build it!. 

A simple way to dump MBTiles packages to flat directory structures (/Zoom/X/Y.png) for use in slippy maps, is MapBox's MBUtil.

MBUtil is a simple python app that reads the MBTiles SQLITE database, and can export to a directory. 

Use is dead simple:

python mb-util Sandy_OSMBright_North_East_US_15.mbtiles /somedirectory

Also, Michal Migurski's TileStache will directly serve an MBTiles dataset without needing to inflate the package to tiles on disk, it just takes a little configuration to do so.

An alternative to this approach for Android users, is to use Offline Google Maps. You can easily save offline maps for Sandy's impact area in the Google Maps application while you still have an internet connection.


Wednesday, September 1, 2010

Preparing for Hurricane Earl with Google Earth Enterprise Portable


As of 0800 this morning, there is a chance that Hurricane Earl will glance the Eastern Seaboard of the United States, possibly as a Major Hurricane.

About a month ago, I created a screencast and blog post about the new Google Earth Enterprise Portable system and how we had prepared a Google Earth Enterprise globe of 1-meter NAIP imagery and OpenStreetMap.org vector data for the Gulf and Atlantic coasts of the United States in preparation of an active 2010 hurricane season.

The portable cutting works very well and it took just over 16 minutes to create a complete copy of the Google Earth globe that a first responder would want to take into the field with them should Earl make landfall and knock out communications infrastructure.

To review, this is how simple it is to create a Google Earth Enterprise Portable globe for field deployment.

1. Prepare to Cut


The Google Earth Enterprise software includes a web-based cutter application which asks you to name the globe you'd like to create, specify a spatial extent, and provide a brief description.

In this case, I'm using the NOAA National Hurricane Center's 72 Hour Cone of Uncertainty as my spatial extent. This means that the cutter will cut from the globe at relatively low resolution outside the cone, and at full resolution inside the cone.

2. Cut

The next step is to hit the "Build" button and wait while the portable globe is generated.

The cutting operation created a 4.61 gigabyte globe in just over 16 minutes. As the graphic illustrates, almost all of the Outer Banks in North Carolina and parts of the sound intersected the cone of uncertainty, so this globe will have the complete raster and vector data for these areas in full resolution. 

3. Download and Serve

Once the globe is created, it is available to the entire organization or access group of the administrator's choosing and the single .glb file can be downloaded to run on Windows, Mac, or Linux desktop computers or laptops.

The globe can be either used locally by 1 user, or broadcast over a local area network for 10 users to share - all without any connectivity to the internet or external networks.


The .glb file can be instantly dropped into the Google Earth Portable "Globes" folder and the browser-based interface will allow you to select this or any other .glb file you have on your system. You can connect to the globe either with the Google Earth API browser plugin (by clicking "view in browser") or you can view the globe in the full Google Earth Enterprise Client by connecting to the localhost server.


Shown in the browser plugin, you can see how areas to the north and west of the area of interest are blurry and lack vector data, but areas where Hurricane Earl might make landfall are in full resolution. 


Zooming in, you can see the detail of the cut imagery and vector data which would be available to anyone in the field.

For a more detailed discussion about this process, feel free to review the previously posted screencast about Google Earth Enterprise Portable and Hurricane Preparedness here:


If you have any questions, please contact us at google-hurricane-2010@googlegroups.com .

Wednesday, July 28, 2010

Google Hurricane Response 2010


Click Here to Play in Full Screen 720p HD

It has been another remarkable year for those of us in the geospatial community. Looking back, we've learned a lot as we strive to make an impact for the good of all with our technology, particularly in times of crisis. Sadly there have been many crises this year from which to learn, be they war, drought, fire, earthquake, political revolution, oil spill, etc.

I don't know, maybe the world has always been this turbulent. Maybe now we just notice it more because we are all hyper-connected and can freely pass information around the world at an unprecedented rate. That is of course, when all the lines of communication are up and operating optimally. 

We've learned however that far too often, in times of crisis, those lines of communication fall apart. Sometimes, we forget that there are parts of this world that are still years, if not decades, away from broadband internet. Still, we expect our soldiers, our humanitarians, our first responders and our volunteers to head off into these situations to get whatever job needs to get done done.

At Google, we've worked with these awe-inspiring individuals as our customers, our friends, and even our own family members and we've learned a lot about what doesn't work for them in that last tactical mile or when some natural disaster has wiped out infrastructure.


When we heard the reports about the National Hurricane Center's dire prediction for the 2010 Hurricane Season we made a conscious decision to be proactive and be prepared rather than waiting and reacting if and when one of these storms threatens to make landfall this summer. 

To that end we built a Google Earth Enterprise 4.0 globe, which is detailed in the video above, precisely designed to generate Google Earth Enterprise Portable globes in the event of a major hurricane. The globe is built from 103 counties worth of United States Department of Agriculture's Farm Service Agency National Aerial Imagery Program acquired from the USDA Geospatial Gateway county imagery mosaics and extracted vector data from the Open Street Map project. Portable globes can be cut from this globe extremely quickly and be distributed days or even hours before landfall if the storm makes an unanticipated deviation in course.

If a major Hurricane threatens the US this year, we are ready to help. Please watch the video above to learn more about this effort and please feel free to contact the Google Hurricane team at google-hurricane-2010@googlegroups.com should you have any questions or would like more information.

Friday, May 7, 2010

Assembling Virginia's Geospatial Data with Google Earth Enterprise

Over the course of the past few weeks I've spent some time scouring the internet and university websites in the Commonwealth of Virginia to try to collect as much publicly available geospatial data as I could. To my delight, there is a lot more data online now than back in the 2000-2005 timeframe while I was a student at Virginia Tech's Geography department, working with Virginia GIS data quite regularly.

However, it could be a lot simpler. Not only did I have to spend a great deal of time searching for the data, often it was warehoused in sites that were not friendly to bulk downloading the entire state at once. Some scripting helped here, but it was still somewhat cumbersome.

I also found lots of dead links, even on sites like Virginia.gov. This includes the occasional missing file, or worse, sometimes entire data-sets have disappeared.

Also I have to say that my overall experience working the nearly 500GB of data that I did find was disappointing. Data in the Commonwealth of Virginia is primarily found in one of five projections.
  • UTM Zone 17
  • UTM Zone 18
  • Virginia State Plane North
  • Virginia State Plane South
  • A custom Department of Transportation Lambert Conical Statewide projection
  • or, Unprojected WGS84
Now, knowing this helped a great deal because SOOOOO MUCH of the data comes without accompanying projection files, or any metadata that describes what projection any given piece of data may be in. Frustratingly, much of the data was also commingled so that you might literally have all 5 projections for a single data-set seemingly randomly distributed throughout a single data-set. This likely occurred because the data was never really assembled all together in a seamless GIS before, and instead the tiles were used one or two off at a time in desktop GIS software. 

I wanted to be able to visualize all this data in one environment though, so I've done a lot of work to fix the problems, and where possible, track down the source data from the original providers. I'm very happy to find a good steward of this data for the Commonwealth now that I've corrected it so that others can find clean data to use in their project. 

I have only just scraped the tip of the iceberg of the total GIS data for the Commonwealth - there is so much more out there hidden in all of municipalities web-based GIS systems that would be fantastic to incorporate. 

I also hope that one day the work I've done on the Google Earth Enterprise system will be made available to the citizens of the Commonwealth. After all, it is your tax dollars that are paying for all this data - you should demand a way to use it easily! 

If you're interested in seeing the Google Earth Enterprise for the Commonwealth of Virginia's progress thus far, and for more discussion about existing GIS data-sources in the Commonwealth, please view the video below. 

If you have any questions please leave a comment, or e-mail my colleague at Google, Mary Jean Clark.

Friday, March 5, 2010

Geotag Photos with an Android Phone and Any Digital Camera


There are many ways to add geospatial information to photos, whether you use Flickr or Picasa's Heads-Up Digitizing Tools, or an expensive camera with a built-in GPS, a camera phone that has a built in GPS, or a GPS Data Logger and a standard Digital Camera. However, I wanted to share a way I use an Android Smartphone (Motorola Droid) and a standard point-and-shoot Digital Camera (Canon SD780 IS) together in a hybrid approach to automatic geotagging. 

This approach lets me cut down on the devices I need to carry along with me (don't need to carry a GPS data logger anymore), and lets me shoot higher resolution images than the 5MP camera on the Droid would allow. 

The Tools You'll Need:

Android Apps:

My Tracks for Android:

GPS Test for Android:
Linux / Mac / PC App:

gpicsync: Follow the instructions for installing on your OS.

Step 1. Start Logging:

Launch My Tracks and from the context menu choose "Record Track," this will start the My Tracks data logger. 

You'll need to keep your phone out (screen can turn off) for the duration of your picture taking - My Tracks will record your track.

Step 2. Launch GPS Test:

As with using a stand-alone GPS, you need to take a temporal reference photo to figure out the time difference between the GPS system (in which your log file will be recorded) and the camera time (which will be timestamped in each image). 

To take this image, use the free app GPS Test to display the current GPS time in the UTC time zone. 

Step 3. Set Your Camera's Time:

My camera has a home / away function so I can set my home time zone but also an "away" time zone - in this case my "away" time zone will be UTC time. Your camera may vary, but try to set the time as closely as possible to the UTC time shown in the time screen of GPS Test.


Step 4. Take a Picture of Your Phone:

From the Time screen in GPS Test, take a photo of your phone's screen with your camera - this picture will serve as your temporal reference in gpicsync so you can investigate the time difference between the GPS and your camera when you go to sync the photos to the GPS track.


Step 5. Keep You Phone Out, Take Pictures:

Your phone can probably stay in your pocket, but it needs a view of the GPS constellation to record your track well.

Step 6. When Finished Shooting, Stop Recording Your Track:

Use the context menu in My Tracks to select "Stop Recording".

You should have a nice map that shows you the track you collected.

Step 7. Send Yourself Your Track:

Use the "Share With Friends" feature of My Tracks to e-mail yourself a "GPX" version of your track, you will use this file as your track in gpicsync.


Step 8. Launch gpicsync, Fix Time: 

The first thing you need to do is to set up the time correction, from the Options menu choose "Local Time Correction"

Open the temporal reference image in a program like Google's Picasa, or just Windows Explorer or Mac OSX's Finder to simultaneously see the timestamp (camera date) of the image and the time that is shown by GPS Test for the UTC time.


Enter these values into the Local Time Correction Dialog.


Step 9. Select Your GPX Track and Photo Directory

For the "Pictures Folder," select the directory on your computer where you have downloaded the photos you want to be automatically geotagged in the gpicsync application. 

For the "GPS File," select the GPX file that you previously e-mailed yourself. 

Click "Synchronize" and gpicsync will index the times in the GPX file and then for each image in the directory check the timestamp of that image against the index to see where you were when that photo was taken and automatically will update the image's EXIF Header to include a GPS position. 


When finished, you will have a directory of automatically geotagged photos, a backup of the original photos, and even a KML file that you can open and view your photos spatially in Google Earth.

Or, you can just upload the photos to a site like Flickr or Picasa and the website will automatically read the EXIF Headers and will store your photos as geotagged photos online.

Check out an example of a recent Helicopter tour I took with my parents and the geotagged photos I took using this method here.

Tuesday, January 19, 2010

Utilize NGA Geoprocessing Tasks For Haiti in Your Applications

I was very impressed last week with the speed in which the National Geospatial-Intelligence Agency's eGEOINT Management Office made some useful web-based GIS tools available for first responders to the Haitian Earthquake.

The "DemoBase Haiti" site unfortunately still only works in Internet Explorer, which I've communicated to the agency is DEFINITELY NOT the browser of choice for pretty much anyone I know that is responding to the earthquake with their geospatial skills.

Go to a CrisisCamp or OSM Mapping Party and count the default IE users on one hand....they probably just got a laptop with Windows and haven't had a chance to install Firefox or Chrome or to wipe the hard drive and install Ubuntu :)

However, IE remains the security-threat cesspool of choice for the US Government computers so I guess most development STILL gears itself with IE as a baseline.

Well, I thought it would be useful to expose the really powerful pieces of the DemoBase tool, the Geoprocessing Tasks, to anyone that wants to call on the NGA / NRL servers in their web-based applications.

The DemoBase tool currently has one very nice GP task, a Zonal Statistics tool that allows you to draw a polygon anywhere in Haiti and get back a Population estimate.....as accurately as the ESRI Zonal Statistics tool and the NGA data is anyway.....like I said, it is an estimate.


But, it could be incredibly helpful for those on the ground to be able to view recent imagery in an application and then just digitize a polygon on a city block of rubble and be able to estimate the population of that block.

I'm not a full time ESRI JavaScript API developer, but I did get some help from David Spriggs at ESRI to boil down a process for sending a simple polygon to the ArcGIS Server and receive a population estimate in return - I hope it is helpful for anyone trying to add some analytic capability to their Haitian support efforts.

I also hope that a more widespread use of the geoprocessing tasks will show the agency how powerful exposing these services can be and they'll continue to offer more geoprocessing tasks to their current offering - lord knows they have the data to make some very useful and interesting applications....

In my example, I simply create a polygon (a rectangle) out of an array of coordinate pairs - but you should be able to adapt the functions to any GeoJSON or other polygons you might have in your application.

My code will simply initialize and send the polygon through to the Geoprocessing Task and then display the result.

Here is the code

Friday, January 15, 2010

Haitian Earthquake Emphasizes Danger of a Split Geo Community

My career has afforded me the opportunity to be part of what I believe to be a wonderful and generous community; the world geospatial community. A typically happy group of geo-nerds armed with laptops, gps enabled gadgets, and a strong foundation of thinking spatially.

Now, this community certainly has some big business motives behind it, but whenever there is a disaster, or crisis like we are seeing now in Haiti, this community comes together and throws everything it has to offer to help. It energizes me to do what I can to help in these times of need and dedicate myself to applying my trade to the cause. And as a Google employee, I'm blessed to have the full support of my management to work full time when necessary on these events.

While the first few hours of this particular disaster were frustrating as I watched the machine slowly gear up, I am blown away at the response we've pulled together - we're actually learning from these events and each one seems to get a little easier to manage - even if the scale of the disasters always seems to increase.

I sat on an early conference call with representatives of all the major GIS vendors, first responders, geo-nerds, NGOs, govies, and the media where everyone brought what they could do to the table and people teamed up to go do what they do best together.

For example, I watched Google, DigitalGlobe, and GeoEye all work together to get stunning imagery collected, processed, and published FREE to the international community to help a wide array of aid workers and first responders within 24 hours.

I watched the National Geospatial Intelligence Agency, the US State Department, and other government agencies get critical and informative data and applications out the door and into the hands of people that needed them within mere hours of the disaster - a far improvement from the Katrina days!

Perhaps most impressive has been the response that Mikel blogged about to the utter lack of vector data that the Geo Community had access to just after the earthquake.

Stealing his images, just look at the difference in OpenStreetMap Port-au-Prince in just a few days of the Geo Community swarming and finding old CIA library maps, public domain maps, etc and the new imagery released by the commercial satellite providers.


OSM just after the Earthquake


OSM Today


Now, that transformation is wonderful - it is astounding - but it isn't complete because there is a Split in the Geo Community that isn't being well addressed.

OpenStreetMap is not the only community data collection platform - Google also has MapMaker which has similar tools and goals, and has done a very great job of expanding Google Maps to areas of the world where data was not traditionally available. If I lived in an area that previously had blank Google Maps coverage, I was given the tools to fix that problem and many users around the world have been happy to work on maps of their own area so they can enjoy Google Maps, Directions, etc.

I thought it was great that in addition to the countries from which Google already allows non-profits to download MapMaker data, that Google added the data from Haiti and is now allowing any non-profit to download and use Google's data to help during this crisis.

But OSM and MapMaker aren't talking and I think it is a big problem - if you want to help rescue efforts in Haiti where do you go to digitize? OSM? MapMaker?

How can 2 projects be expected to be in synch? Which is more "correct"? Which is more current?

This split means that these questions have to be asked by first responders, and by those working to create products for them.

"Is that road up there passable?" "Does it really exist?"

It means that the Geo Community is responsible for an extra decision between a first responder and a VICTIM.

As it stands right now, even though the MapMaker data is free for non-profit use, projects like OSM can't use the data because there are commercial uses for OSM and the data belongs to Google, not OSM.

These are the old fights of GIS data; these are Navteq and TeleAtlas bugaboos IMHO, not what I expect to see today!

The differences are pretty glaring between OSM and MapMaker in some cases - take a look at the data I downloaded from both over Port-au-Prince.


The data is similar, but different, and needs to be conflated. Where that conflation happens, how it happens, I don't know - but I do know that we need to do something to fix this split before it gets people hurt.

That said, it is good to have 2 or more different projects; it forces competition in the tools, each project has different goals and metrics of success, and it probably ultimately means more community contribution as different groups migrate to different platforms  - all adding to the cumulative Geo Community base data.

However, the data ultimately has to be conflated somewhere - and I urge OSM and MapMaker to work more closely with each other and build some sort of cross platform utility that lets users share edits and co-create data.